SISOFT SANDRA 2003.
E' giunto il momento dei benchmark con H.T. attivato. Cominciamo con i risultati ottenuti con SiSoft Sandra. L'immagine seguente è frutto del benchmark CPU ARITHMETIC.
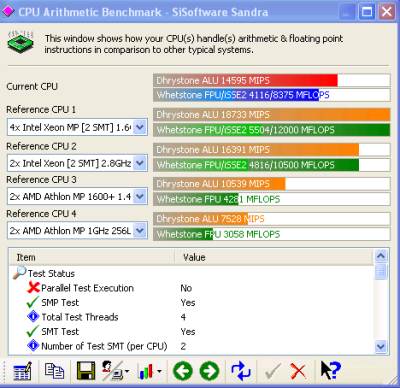
FIGURA 28.
Leggendo i risultati, si riesce a capire che il valore Dhrystone ALU è uguale a 14595 MIPS, mentre il valore Whetstone FPU/iSSE2 è uguale a 4116/8375 MFLOPS.
Ora, è il momento dell'immagine ottenuta dal benchmark CPU MULTIMEDIA BENCHMARK.
![]()
FIGURA 29.
Come potete vedere il valore Integer iSSE2 registra un valore di 22478 it/s, mentre il valore iSSE2 è uguale a 32880.
FRESH DIAGNOSE 5.70.
I risultati ottenuti con questo software di test sono stati veramente interessanti, come da immagini seguenti.
Processor Benchmark.
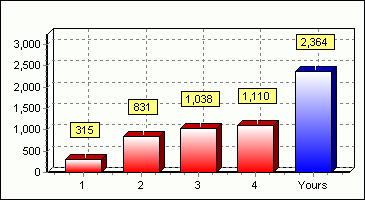
FIGURA 30.
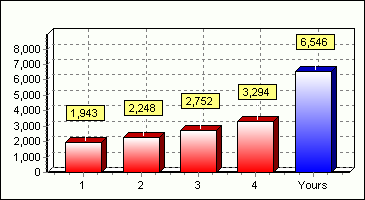
FIGURA 31.
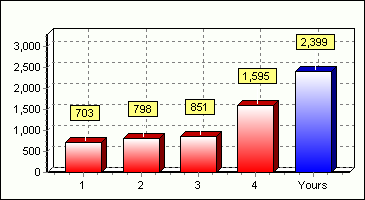
FIGURA 32.
Cpu multimedia benchmark.
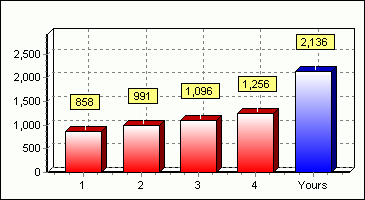
FIGURA 33.
SPECVIEW PERF 6.1.2
Ecco, i risultati dei test effettuati con il benchmark SPECVIEW PERF 6.1.2. con ben 4 Xeon virtuali.
TABELLA H.
3D MARK 2001 SE.
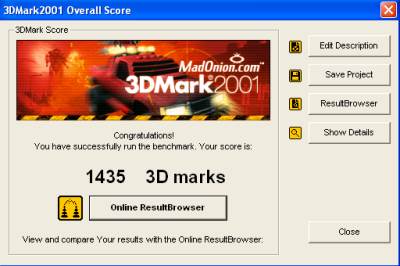
FIGURA 34.
Non poteva mancare il benchmark più famoso al mondo: 3D MARK 2001 SE. 4 CPU Xeon virtuali e una Matrox G550, non una Workstation ma un bel sistema database Server. Se al posto della scheda video Matrox avessimo provato una scheda video Radeon 9700 Pro cosa avremmo ottenuto?
Menu Sezione/Pagina Precedente/Pagina Successiva/Torna alla Homepage
Sito:megaoverclock.supereva.it